How to Eliminate Spreadsheet Guesswork and Predict Revenue with Confidence
Published by: Gautham Krishna RJul 02, 2026Blog
Introduction: The Forecasting Crisis No One Is Talking About
Here's an uncomfortable truth: 68% of sales leaders report that their sales forecasts are inaccurate or unreliable -- despite decades of investment in CRM systems, analytics tools, and forecasting methodologies.
Only 7% of sales organizations consistently achieve forecast accuracy of 90% or higher. The median forecast accuracy among surveyed organizations sits between 70% and 79% -- meaning the average sales leader is flying blind on roughly one out of every four dollars of projected revenue.
And it's getting harder. A staggering 69% of sales operations leaders report that forecasting is becoming more challenging.
This isn't a failure of effort. It's a failure of visibility.
Sales leaders are drowning in data but starved for insight. They have CRM systems capturing hundreds of data points per opportunity, yet they're still exporting to Excel, building pivot tables, and manually flagging at-risk deals. The spreadsheet -- a tool designed for static analysis -- has become the default "solution" for a problem that demands real-time intelligence.
This guide explores how AI-powered pipeline and forecast analysis transforms sales forecasting from a guessing game into a predictable, data-driven discipline. No more spreadsheet guesswork. No more end-of-quarter surprises. Just real-time visibility into pipeline health, forecast risks, and the deals that actually matter.
Why Traditional Pipeline Analysis Falls Short
The Spreadsheet Trap
Spreadsheets are the sales manager's crutch -- and their Achilles' heel.
The moment a spreadsheet is created, it's already outdated. Sales reps update deals at different cadences. Opportunities move stages. Next meetings get scheduled and rescheduled. By the time a manager has consolidated all the data, the reality on the ground has shifted.
Yet 87% of enterprises missed their forecasts in recent years, with many teams still relying on spreadsheets as their primary forecasting tool. The spreadsheet isn't just inefficient -- it's actively undermining forecast accuracy.
Even when teams use their CRM, the data is rotting beneath them.
Gartner found that 30% of CRM data is outdated within 12 months. B2B contact information decays at an average rate of 22.5% per year -- and that number jumps to 35% for high-growth companies where people change roles frequently.
What does this mean in practice?
- Reps calling phone numbers that no longer work
- Sales sequences firing at people who left months ago
- Forecasts built on accounts that don't even exist
- Sales and marketing teams arguing over what's "real"
Most teams don't realize it's happening until deals start slipping. They question the SDR. They question the messaging. They question the channel. But they rarely question the data driving all those activities -- data that is quietly decaying in the background.
Organizations lose an average of $12.9 million annually due to poor data quality. Clean data isn't optional anymore. It's the baseline for any serious go-to-market motion.
The Human Bias Problem
Traditional forecasting relies heavily on rep intuition and subjective probability estimates. The results are predictable -- and consistently wrong.
Reps carry optimism bias. They set close dates based on when they want the deal to land, not when the buyer's procurement process will actually complete. Managers apply their own corrections on top, usually overcorrecting in the opposite direction. By the time the number reaches the VP, it has passed through three layers of subjective judgment -- with no objective signal data underneath.
Traditional sales forecasting produces an average accuracy rate of just 51%.
Information Silos
Pipeline data lives in the CRM. Customer intent signals live in marketing automation. Post-sale usage data lives in the product. Competitive intelligence lives in spreadsheets and Slack channels.
When data is fragmented, even the best methodology feels like guesswork. The result? Only 35% of sales professionals completely trust the accuracy of their data.
The Business Impact of Inaccurate Forecasting
The cost of poor forecasting extends far beyond missed numbers.
Forecast inaccuracy leads to an average of 15% revenue variance, forcing reactive decisions on hiring, inventory, and resource allocation. When you can't predict revenue accurately, you can't plan effectively.
Consider the cascade:
- Hiring plans freeze when forecasts miss -- you can't justify new headcount without confidence in revenue
- Marketing budgets get cut mid-quarter -- campaigns that could have generated pipeline are scrapped
- The CFO loses confidence in the CRO's projections -- which impacts board reporting and investor relations
- For public companies, a guidance correction moves the stock price
The data is stark: 4 in 5 sales and finance leaders have missed a quarterly sales forecast in the past year, with more than half missing it at least twice in a row.
And sales cycles aren't getting any shorter. B2B sales cycles have lengthened roughly 22% since 2022. Buying committees are larger. Budget scrutiny is tighter. Procurement processes are longer. The structural forces that extend sales cycles are not reversing.
Yet organizations with strong pipeline management have 15% higher win rates and 28% more accurate forecasts. The correlation is clear: pipeline health is forecast accuracy.
What AI-Powered Pipeline Analysis Actually Does

Real-Time Pipeline Health Monitoring
AI continuously analyzes pipeline data rather than relying on weekly snapshots. Instead of asking "what happened last week," you can ask "what's happening right now?"
True visibility requires completeness, accuracy, and timeliness -- three things that spreadsheets and periodic reporting simply cannot deliver. AI ingests data from across your sales stack, surfaces anomalies, and alerts you to problems before they become crises.
Automatic Risk Identification
AI flags forecast risks automatically. No more manual sifting through spreadsheets.
The use case from the brief is illustrative: a Sales Manager using AI-powered pipeline analysis receives a Forecast Risk Summary that includes:
- Coverage gap: Enterprise pipeline is below target for Q3 commit
- Forecast risk: 6 late-stage deals have no confirmed next meeting
- Stage concern: Proposal-stage opportunities are aging longer than last quarter
- Positive signal: Manufacturing segment pipeline increased this month
These insights are delivered in seconds -- not hours. The manager can immediately review stalled commit deals and confirm next steps with opportunity owners, walking into the forecast review with confidence and a clear action plan.
Natural Language Analytics
AI-powered platforms enable natural language queries. Sales leaders can ask questions in plain English and get instant answers:
- "Show me all enterprise deals at risk this quarter"
- "Which reps have the lowest pipeline coverage?"
- "What deals have been in Proposal stage for more than 60 days?"
This transforms reporting from a backward-looking chore into a forward-looking strategic capability.
Pipeline Visualization That Actually Helps
Visual dashboards communicate instantly -- pipeline funnels, coverage ratios, stage conversion rates, and deal aging all in one view. The best AI platforms generate roll-up views by team, region, segment, stage, or forecast category, so managers can inspect the right opportunities at the right level of detail.

Pipeline Coverage Ratio
Pipeline coverage ratio = Total Qualified Pipeline Value ÷ Sales Quota.
The standard benchmark is 3x for enterprise sales and 4-5x for mid-market. If your quarterly quota is $500,000, you need $1.5M to $3M in active pipeline.
Teams with consistently high coverage ratios typically achieve forecast accuracy above 90%. Early-stage startups with uncertain win rates should maintain 5x coverage to account for higher volatility.
Most teams, however, overstate coverage by including stale deals and measuring at the wrong point in the quarter. AI-powered analysis helps you calculate coverage accurately -- excluding deals that should have been closed or disqualified.
Forecast Accuracy
Forecast accuracy measures the gap between projected and actual revenue. The median B2B forecast accuracy sits at 70-79%. Only 7% achieve 90%+ consistently.
AI-powered forecasting produces an average accuracy rate of 79% -- a 28-point improvement over traditional methods. Organizations report forecast accuracy improvements ranging from five to fifteen percentage points when transitioning from traditional methods to machine learning approaches.
Deal Aging
How long do opportunities stay in each stage? Aging proposal-stage deals are a red flag -- they indicate stalled momentum, unresolved objections, or buyer hesitation.
Organizations with weekly pipeline velocity tracking achieve 87% forecast accuracy versus 52% for teams that track irregularly. The frequency of inspection directly correlates with the quality of prediction.
Stage Conversion Rates
Stage conversion rates measure the percentage of deals that move from one stage to the next. Declining conversion rates signal pipeline problems before they impact revenue.
A 5-point improvement in conversion rate alone can lift revenue up to 18%. Most teams obsess over top-of-funnel volume when the real leverage is mid-funnel conversion.
Sales Velocity
Sales velocity measures how quickly deals move through the pipeline. Slowing velocity = growing risk. If deals are taking longer to close, your forecast is at risk -- even if the pipeline looks full.
Real-World Use Case: Enterprise Pipeline Analysis in Action
Scenario: A Sales Manager at a B2B SaaS company needs to analyze the enterprise pipeline for Q3.
The Manual Approach:
- Export CRM data to Excel (45 minutes)
- Clean and format the data (30 minutes)
- Create pivot tables by stage, region, and segment (60 minutes)
- Manually identify coverage gaps (30 minutes)
- Flag deals with no recent activity (30 minutes)
- Build a presentation for the forecast review (90 minutes)
Total time: ~4.5 hours. And by the time the presentation is delivered, the data is already stale.
The AI-Powered Approach:
- Open the platform
- View the Forecast Risk Summary generated in real time:
- Coverage gap: Enterprise pipeline below target for Q3 commit
- Forecast risk: 6 late-stage deals with no confirmed next meeting
- Stage concern: Proposal-stage opportunities aging longer than last quarter
- Positive signal: Manufacturing segment pipeline increased this month
- Click through to the risk deals list
- Review stalled commit deals and confirm next steps with opportunity owners
- Walk into the forecast review with confidence
Total time: ~15 minutes. No manual spreadsheet required. Insights delivered in seconds, not hours.
The ROI of AI-Powered Pipeline Analysis
Time Savings
Sales managers spend hours each week on pipeline reviews and forecast preparation. AI reduces this to minutes -- freeing managers to focus on coaching, deal strategy, and revenue growth.
Revenue Protection
Catching at-risk deals early means more deals close on time. Organizations with strong pipeline management have 15% higher win rates and 28% more accurate forecasts.
Better Decisions
Real-time visibility enables proactive course correction rather than reactive scramble. You can address coverage gaps before they become missed quarters, and intervene on stalled deals before they slip.
Reduced Admin Burden
Managers can focus on coaching, not spreadsheet manipulation. Reps can focus on selling, not data entry. The entire organization operates more efficiently.
Improved Forecast Confidence
Walk into board meetings with data you trust. 97% of sales and finance leaders agree that better data would make accurate forecasting significantly easier. AI-powered analysis delivers exactly that.
Key Criteria
1. Real-Time Data Integration
Not weekly snapshots. Not periodic syncs. Real-time visibility into your pipeline requires live data integration across your entire sales stack.
2. Natural Language Query Capability
Can you ask questions in plain English and get instant answers? If you need a data analyst to build reports, you don't have true AI-powered analysis.
3. Automated Risk Identification
The platform should flag forecast risks automatically -- coverage gaps, stalled deals, aging opportunities, and missing next steps. You shouldn't have to hunt for problems.
4. Customizable Dashboards
Can you roll up views by team, region, segment, stage, or forecast category? Different leaders need different perspectives.
5. Forecast Confidence Insights
The platform should explain which deals are driving forecast movement, so managers can inspect the right opportunities.
6. Recommended Next Steps
Data without action is just noise. The best platforms provide recommended next steps, not just insights.
7. Export and Sharing Capabilities
Can you export summaries for board presentations and share insights with stakeholders?
Common Mistakes to Avoid in Pipeline Analysis
Mistake #1: Relying on Weekly Snapshots Instead of Real-Time Data
By the time you've compiled your weekly report, the data is already outdated. Real-time visibility is the only way to manage pipeline effectively.
Mistake #2: Tracking Everything Instead of Focusing on High-Impact Metrics
More data isn't better data. Focus on the metrics that actually predict revenue: coverage ratio, forecast accuracy, deal aging, stage conversion rates, and sales velocity.
Mistake #3: Ignoring Data Quality
"Garbage in, garbage out." AI is only as good as the data it analyzes. Before implementing AI-powered analysis, ensure your CRM data is clean, complete, and current.
Mistake #4: Using Dashboards for Decoration Rather Than Decision-Making
Dashboards are tools, not trophies. If your pipeline dashboards aren't driving action, they're just expensive wallpaper.
Mistake #5: Waiting Until Quarter-End to Identify Problems
Forecast risks don't appear overnight. They build gradually -- aging deals, slipping close dates, declining engagement. Real-time analysis catches these signals early, when you can still do something about them.
Conclusion: Stop Guessing, Start Predicting
The era of spreadsheet-based forecasting is over.
Sales leaders can no longer afford to rely on gut feel, subjective probability estimates, and weekly snapshots of stale data. The stakes are too high -- and the cost of inaccuracy too great.
AI-powered pipeline and forecast analysis delivers what traditional methods cannot:
- Real-time visibility into pipeline health
- Automatic risk detection before problems become crises
- Actionable insights that drive better decisions
- Forecast confidence that leadership can trust
The question isn't whether to adopt AI-powered analysis. It's whether to adopt it before your competitors do.
Organizations that embrace AI-powered forecasting achieve 79% accuracy compared to 51% for traditional methods. They have 15% higher win rates and 28% more accurate forecasts.
Stop guessing. Start predicting.
Frequently Asked Questions
Q1: What is AI-powered pipeline and forecast analysis?
AI-powered pipeline and forecast analysis uses artificial intelligence to automatically analyze CRM data, identify forecast risks, highlight coverage gaps, and provide actionable insights -- all in real time, without manual spreadsheet work.
Q2: Why do most sales forecasts miss the mark?
Research shows 68% of sales leaders don't trust their forecasts. Common causes include CRM data decay (30% of data is outdated within 12 months), human bias in probability estimates, fragmented data across systems, and lack of real-time visibility.
Q3: What is a healthy pipeline coverage ratio?
The standard benchmark is 3x for enterprise sales and 4-5x for mid-market. This means you need $3-5 of qualified pipeline for every $1 of quota to have a reasonable probability of hitting your number.
Q4: How does AI improve forecast accuracy?
AI analyzes historical data, identifies patterns humans miss, flags at-risk deals automatically, and provides objective probability scores. AI-powered forecasting achieves ~79% accuracy versus ~51% for traditional methods.
Q5: What are the key metrics for pipeline health?
The six essential metrics are: pipeline coverage ratio, sales velocity, stage conversion rates, deal aging, engagement scoring, and forecast accuracy.
Q6: How often should sales managers review pipeline health?
High-performing organizations review pipeline health weekly, not just at quarter-end. Teams with weekly pipeline velocity tracking achieve 87% forecast accuracy versus 52% for teams that track irregularly.
Q7: What is the cost of poor forecast accuracy?
Forecast inaccuracy leads to an average of 15% revenue variance, forcing reactive decisions on hiring, inventory, and resource allocation. Poor data quality alone costs organizations $12.9M annually.
Q8: How does pipeline visibility differ from pipeline reporting?
Pipeline visibility is real-time awareness of every deal's status and health. Reporting is backward-looking analysis of what already happened. You can only manage what you can see.
Look for: real-time data integration, natural language query capability, automated risk identification, customizable dashboards, forecast confidence insights, and recommended next steps.
Q10: How does Evalogical help with pipeline and forecast analysis?
Evalogical consolidates pipeline, opportunity, activity, and forecast signals into one real-time management view. It highlights forecast risk, stalled deals, coverage gaps, and missing next steps before quarter-end, and generates roll-up views by team, region, segment, or stage -- so managers can inspect the right opportunities and walk into forecast reviews with confidence.


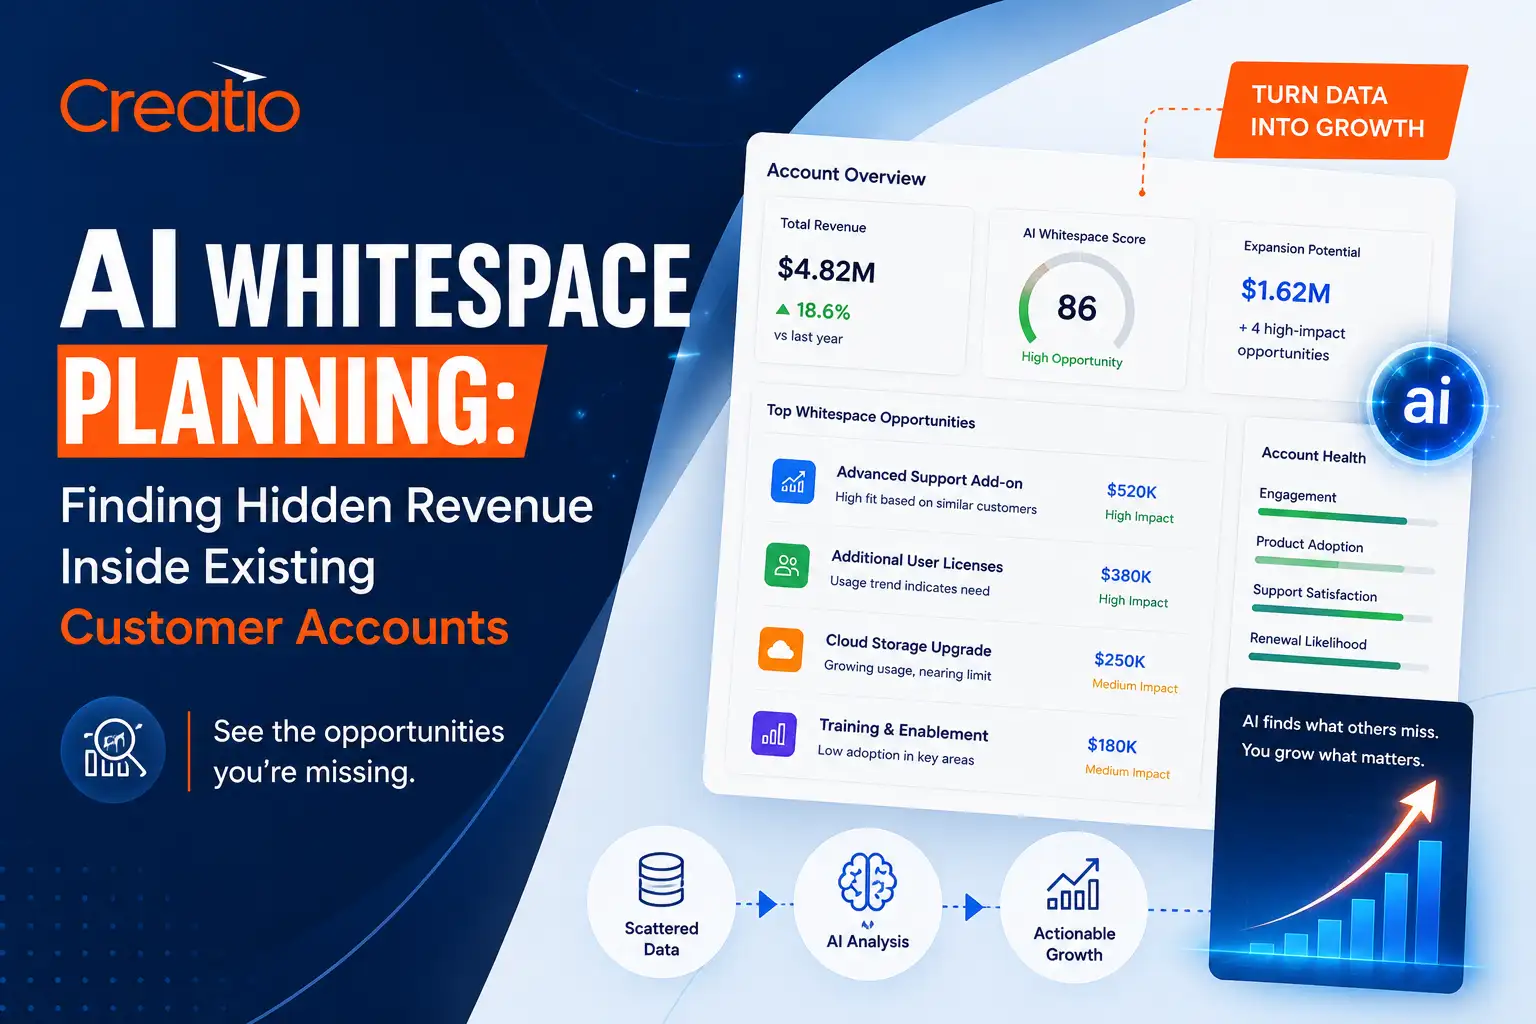 AI Whitespace Planning: How to....
 Why Mid-Sized Enterprises Pref....
 Creatio Implementation Case St....
 Healthcare CRM in India: How H....
 The Role of AI in Banking CRM:....


Your Trusted Software Development Company